
RoofMasterTM
Quick Reference Guide
Table of Contents
2.0 The Engineering Behind RoofMasterTM
2.1 The RoofMasterTM Workspace
2.2.1 The Cylindrical Model Implementation
1.0 Introduction
RoofMasterTM is a RF Compliance software package designed to enable the analysis, assessment and mitigation of communications sites with respect to human exposure to radiofrequency electromagnetic fields.
RoofMasterTM was developed in 2008 by Waterford Consultants to support compliance assessments performed at single and multi-operator wireless locations throughout North America and has been in service since 2008. Real-world experience in evaluating thousands of base station installations is reflected in the RoofMasterTM design approach. This document provides a guide for creating simulations of RF hazard conditions through characterization of antenna systems and site features and through FCC-specified computational analysis.
2.0 The Engineering Behind RoofMasterTM
2.1 The RoofMasterTM Workspace
On any structure, one may encounter antennas installed by wireless service providers, public safety and other FCC-licensed and unlicensed operators. Siting constraints have resulted in diverse and complex environments accessible to people performing a variety of activities around these antennas. RoofMasterTM supports the characterization of these locations to convey important information regarding RF sources and accessible areas necessary to evaluate the potential for human exposure to hazardous levels of RF energy.
RoofMasterTM supports the depiction of communications sites through the display of construction drawing or aerial photography image files as well as providing line drawing tools. These representations are scalable to enable the modeling of any location. RoofMasterTM utilizes a three-dimensional spatial framework consisting of a 1000 x 1000 grid with unlimited vertical dimensions necessary for the positioning of antennas and modeling of RF conditions at each grid point throughout the space. Predictive analysis is performed on a study plane at a specified elevation. The subsequent sections of this guide provide the steps necessary to create a site representation and conduct these studies.
2.2 Modeling
RoofMasterTM employs several power density prediction models based on the computational approaches set forth in the Federal Communications Commission’s Evaluating Compliance with FCC Guidelines for Human Exposure to Radiofrequency Electromagnetic Fields, OET Bulletin 65. This guideline utilizes several antenna and operational parameters in calculating the power density contributions from each emitter at specified points throughout the study space. RoofMasterTM enables antennas to be fully defined in site-specific aspects as well as through the use of a library of manufacturer data. The parameters include:
· Antenna model
· Radiation patterns
· Aperture length
· Gain
· Beamwidth
· Antenna radiation center
· Azimuth
· Mechanical downtilt
· Location
· Frequency
· Power into antenna
2.2.1 The Cylindrical Model Implementation
In OET-65, the Cylindrical Model is presented as an approach to determine the spatially averaged power density in the near field directly in front of an antenna. In order to implement this model in all directions, RoofMasterTM utilizes the antenna manufacturer horizontal pattern data. Additionally, RoofMasterTM incorporates factors that reduce the power density by the inverse square of horizontal and vertical distance beyond the near field region.
Power density is calculated as follows:
![]()
![]()
• S is the spatially averaged MPE value
• R is the horizontal distance meters to the study point
• h is the aperture length in meters
• Pin is power into the antenna input port in Watts
• RoofMasterTM Implementation:
• GH is gain offset to study point as specified in manufacturer horizontal pattern
• Pin is adjusted by the portion of the antenna aperture in the 0-6 ft vertical study zone
• Hr accounts for 1/R2 Far Field roll off which starts at 2xh
• Vr accounts for 1/ (vertical distance)2 roll off from antenna bottom to the top of the 0-6ft study zone (or antenna top to bottom of 0-6ft study zone)
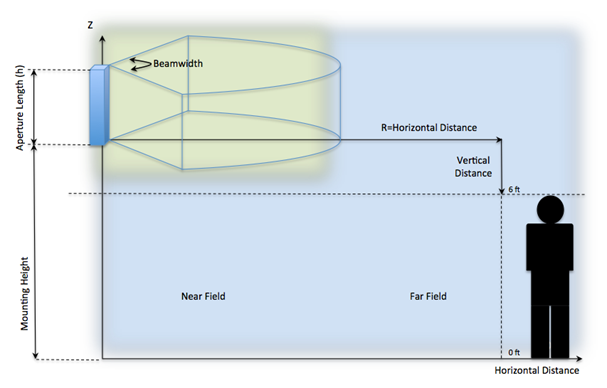
Figure 2.2.1.1 Cylindrical Model Implementation.
2.2.2 The Hybrid Model
In OET-65, a far field model is presented to calculate the spatial peak power density. The RoofMasterTM implementation of this model incorporates antenna manufacturer’s horizontal and vertical pattern data to determine the power density in all directions. Power density is calculated as follows:
![]()
![]()
• Does not include 100% reflection factor
• Pin is Watts
• R is meters to study point
• G is gain to study point as specified in manufacturer horizontal and vertical patterns
RoofMasterTM calculates seven power density values between 0 and 6 feet above the specified study plane and performs a linear spatial average.
The RoofMasterTM Hybrid Model incorporates this far field modeling approach with a modified version of the Cylindrical Model implementation that does not include the far field compensation. A transition technique is employed to change between model results based on position from the antenna.
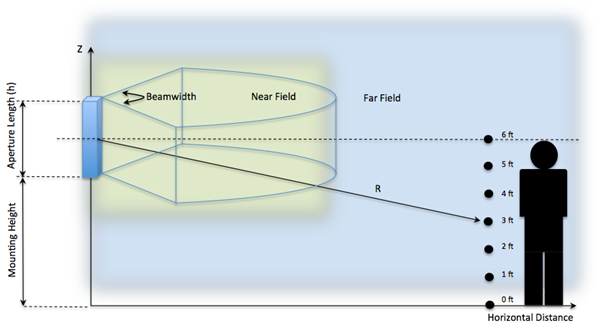
Figure 2.2.2.1 Hybrid Model Implementation
Predicted power densities are displayed as a percentage of the applicable FCC standards.
3.0 RoofMasterTM Features
3.1 Importing Images
Picture Files
JPEG Images are easily imported by dragging an image file into the RoofMasterTM workspace.
![]()
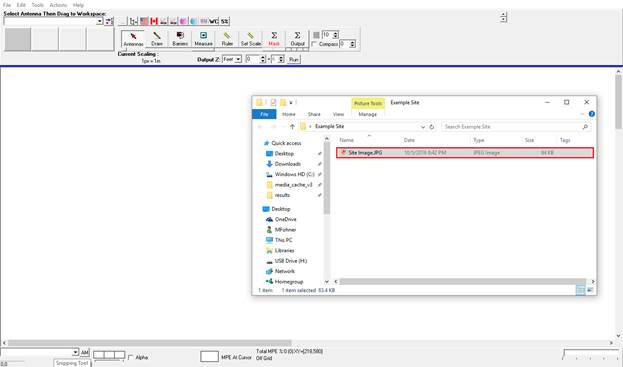
Figure 3.1.1 Drag and Drop Image Step 1
The image will appear and maintain its original aspect ratio automatically.
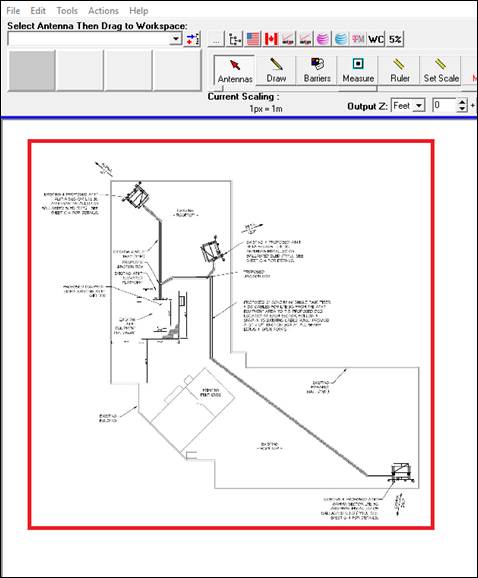
Figure 3.1.2 Drag and Drop Image Step 2
Screen Captures
A screen capture image can also be manually pasted into the workspace by right clicking in the workspace and selecting paste or by pressing the control key plus V key to paste.
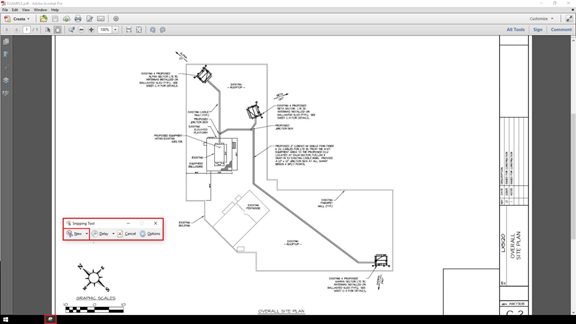
Figure 3.1.3 Screen Capture

Figure 3.1.4 Screen Capture Selection

Figure 3.1.5 Paste Image into Workspace
Click and drag the cursor from the top left corner to the bottom right corner and the image will appear. Hold the Shift key down to automatically maintain the source image's aspect ratio.
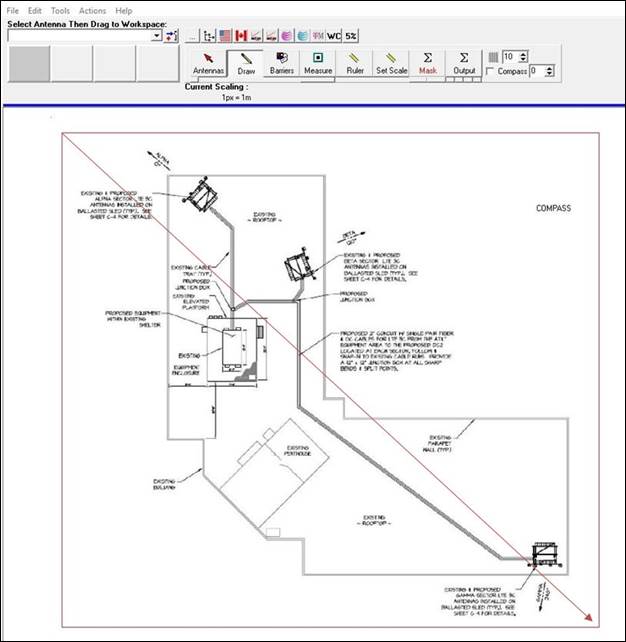
Figure 3.1.6 Click and Drag
PDF Documents
RoofMaster™ can import PDF files that contain an image the user wishes to serve as the site image. This is achieved by selecting Tools > PDF > Import PDF. Next follow the file path to where the document is located on local computer and click Open.
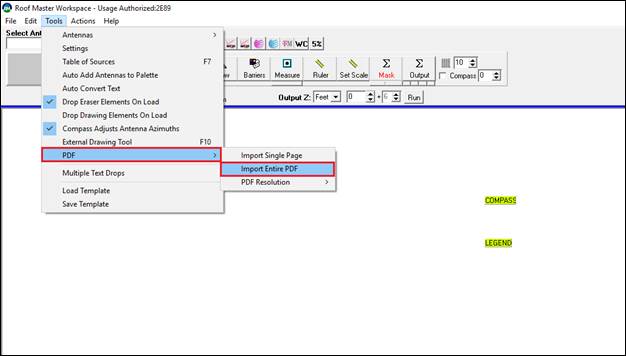
Figure 3.1.7 Tools > Import PDF Step 1
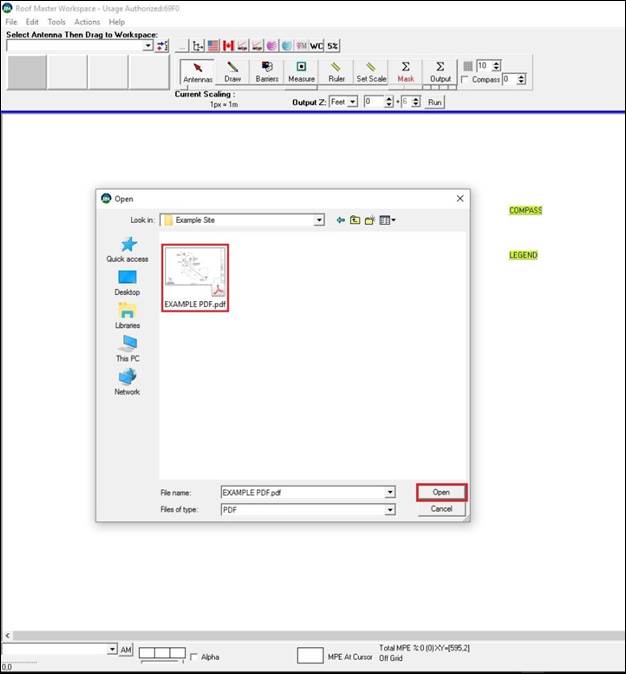
Figure 3.1.8 PDF File Selection Step 2
The PDF document file can also be dragged directly into the RoofMaster™ workspace from the desktop or its file location.
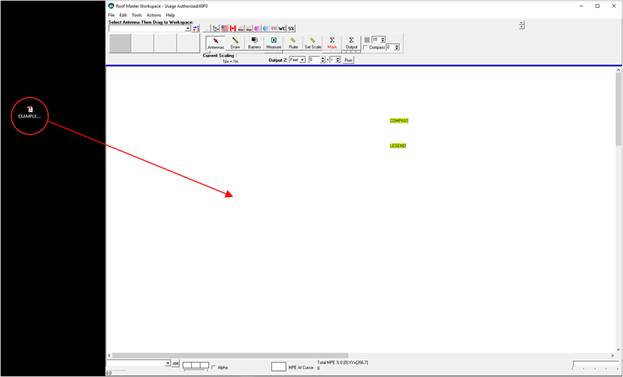
Figure 3.1.9 Drag and Drop PDF File Step 2
After importing the document, the PDF Browser will load inside of RoofMaster. Use the scroll on the left hand side to select the preferred page.
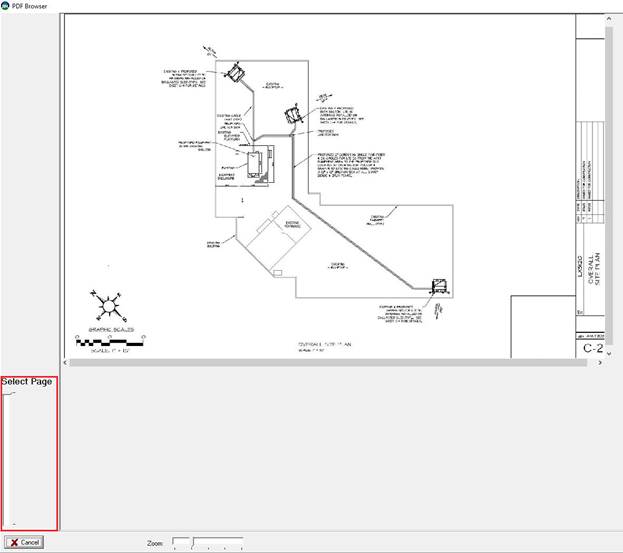
Figure 3.1.10 PDF Browser Step 3
Once the desired image has been located click and drag out the red box to denote the area to be imported into RoofMaster™.
A dialog box will prompt asking if the user would like to Use this selection. If “No” is selected the user will have an opportunity to re-select the desired area.

Figure 3.1.11 Image Selection Step 4
After selecting “Yes” a second dialog box will prompt asking whether RoofMaster™ can Auto Place the Selection into the workspace. If “Yes” is selected the image will be placed onto the workspace automatically and maintain its original aspect ratio.
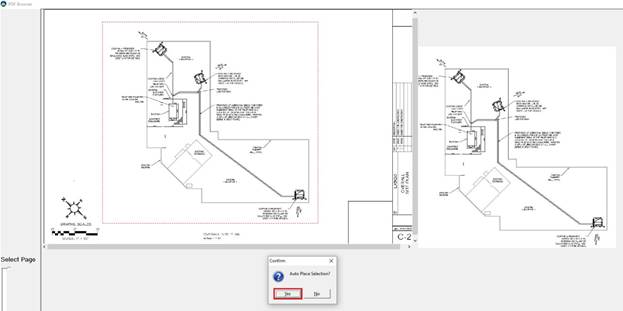
Figure 3.1.12 Allowing RoofMaster™ to Auto Place Step 5

Figure 3.1.13 Image Auto Placed into RoofMaster™ workspace
If “No” is selected the image will be pasted onto the workspace and the user will have the option to click and drag out the image to the desired size.
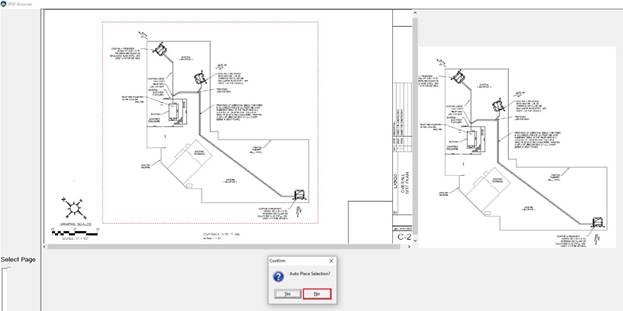
Figure 3.1.14 Selecting No to Auto Place Selection Step 5
Click and drag the cursor from the top left corner to the bottom right corner and the image will appear. Hold the Shift key down to automatically maintain the source image's aspect ratio.

Figure 3.1.15 Click and Drag Image
If the PDF would need to be reused to replace the current selection Click Tools > Reload Last PDF. Follow the previous steps to import the image onto the workspace.

Figure 3.1.16 Reload previous PDF
Scaling the Image
Each RoofMasterTM project drawing must have the scale established in order to create a meaningful output.

Figure 3.1.17 Scale Mode
To begin, click the Set Scale button to enter Scale mode. Next click and drag a Blue line the length of part of the drawing where the linear dimension is known. After dragging out the Blue line a Scale Information box will automatically appear. Enter the correct length in feet or meters. Then click OK.
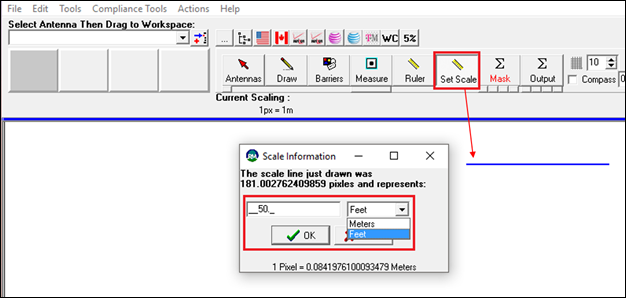
Figure 3.1.18 Scale Information Window
Setting the North Orientation
RoofMaster™ can account for adjustments
made to the image if offset from True North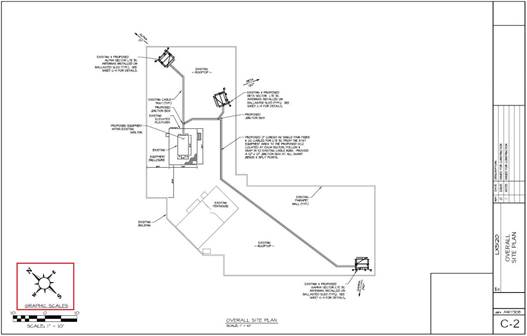
Figure 3.1.19 CD Compass Rose
Type the new north orientation setting into the compass field. All antenna azimuths will now take into account the new setting.

Figure 3.1.20 New
Orientation
3.2 Drawing Tools
Once an image has been imported the user can proceed directly to antenna placement or add elements to the drawing.
Each site is different but a list of common items to consider are:
· HVAC Units
· A/C units
· Access(s)
· Penthouse(s)
· Fire escapes
· Gates
· Fences
· Skylights
· Solar Panels
· Patios
· Public areas
· Equipment Shelters
· Ladders
· Water tanks on rooftop
· Street Lights
Internal Drawing Tools
To use the drawing tools, click the Draw button to switch to drawing mode.
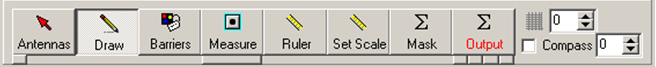
Figure 3.2.1 Draw Mode Button
The drawing tool window will appear.
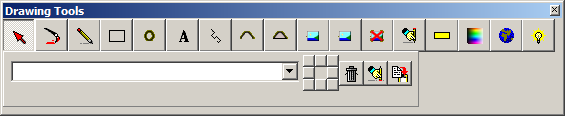
Figure 3.2.2 Drawing Tool Window
Clicking the draw mode button will make the drawing tool window reappear if previously closed
To draw a straight line or a diagonal line, click the Pencil icon. From there the user can click anywhere on the workspace and drag the line out to the appropriate length.
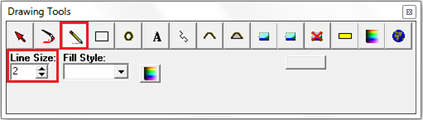
Figure 3.2.3 Line Tool
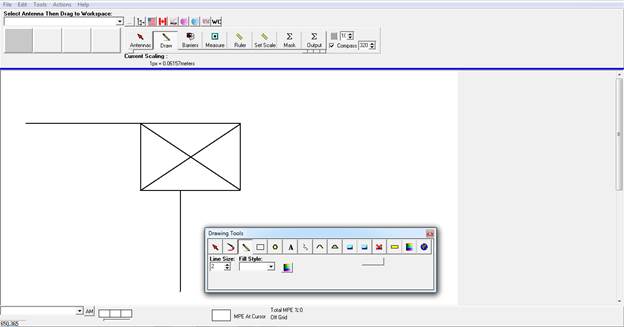
Figure 3.2.4 Example Line Drawing
To draw a square or rectangle, click the Square icon. Next the user can then click anywhere on the workspace and drag out the square or rectangle to the appropriate size.
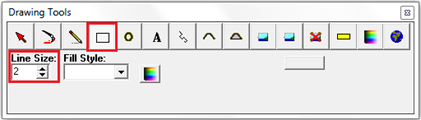
Figure 3.2.5 Rectangle Tool
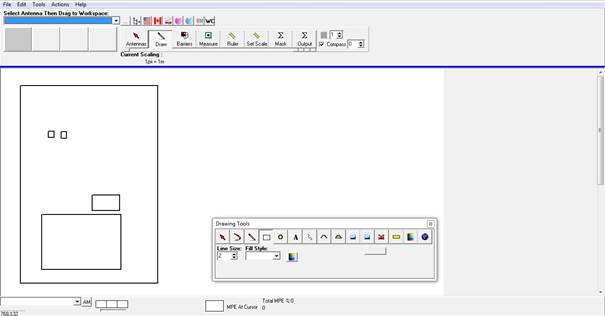
Figure 3.2.6 Example Rectangle Drawing
To draw a circle, click the Circle icon. From there you can click anywhere on the workspace and drag out the circle to the appropriate size. Tip: For a perfect circle hold the shift key while clicking and dragging.
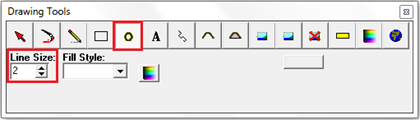
Figure 3.2.7 Circle Tool
![]()
![]()

Figure 3.2.8 Example Circle Drawing
The RED circle indicates the starting point for this circle. If a line were drawn from the top of the circle and the side of the circle the red circle indicates where they intersect.
External Drawing Tools
RoofMasterTM supports the use of many graphics packages. By default, it is pre-configured to use the Windows® Paint program familiar to many users.
Once in drawing mode click the "light bulb / idea" button or press F10 to load the current RoofMasterTM drawing using the external tool.
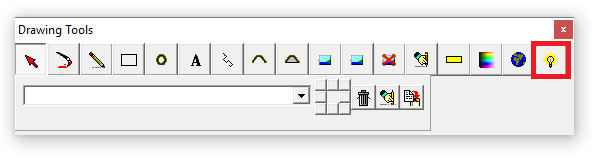
Figure 3.2.9 External Drawing Tool Button
Use the External Drawing Tool to clean up images and CDs
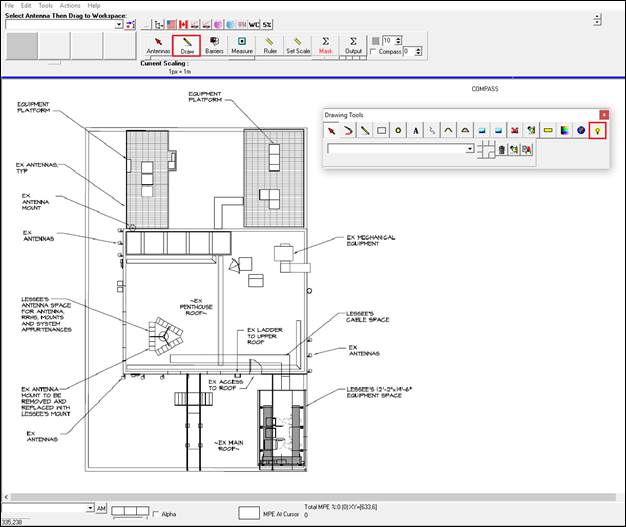
Figure 3.2.10 Example Editing
Once inside Paint there are many options to clean up the image. Click the Select tool and use the rectangular selection to clip and cut unwanted items. Or use the Eraser tool to remove a desired area.
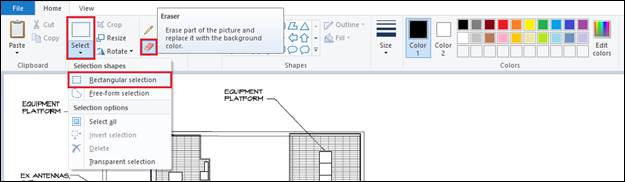
Figure 3.2.11 Editing Tools
|
Before Editing |
|
After Editing |
|
|
|
|
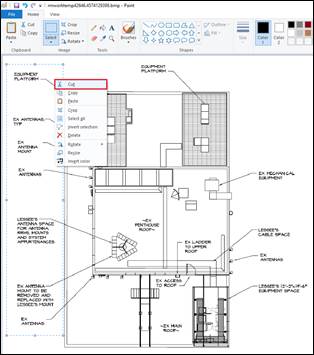
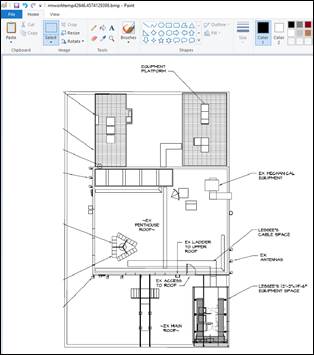
Figure 3.2.12 Editing Results
Once satisfied with the edits click the Save button in Paint and close the program. All the changes made in Paint will transpose to RoofMaster™.
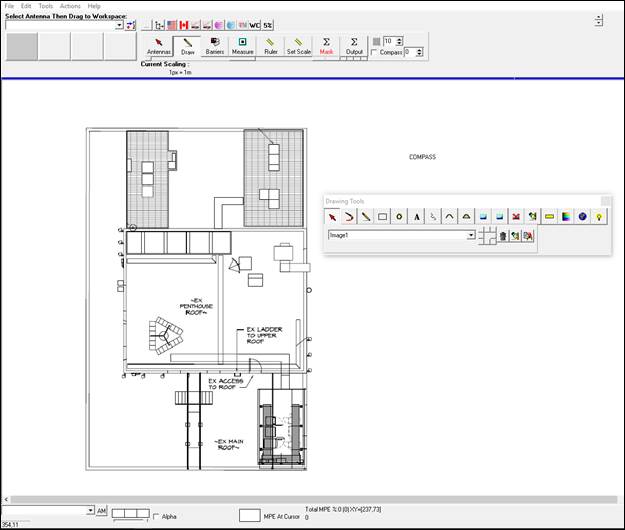
Figure 3.2.13 Example Editing Saved
Use the External Drawing Tool to draw and add items.

Figure 3.2.14 Example Adding Items
Once inside Paint there are many options to draw and add items. Select the desired drawing tool and parameters and begin adding items on to the workspace.
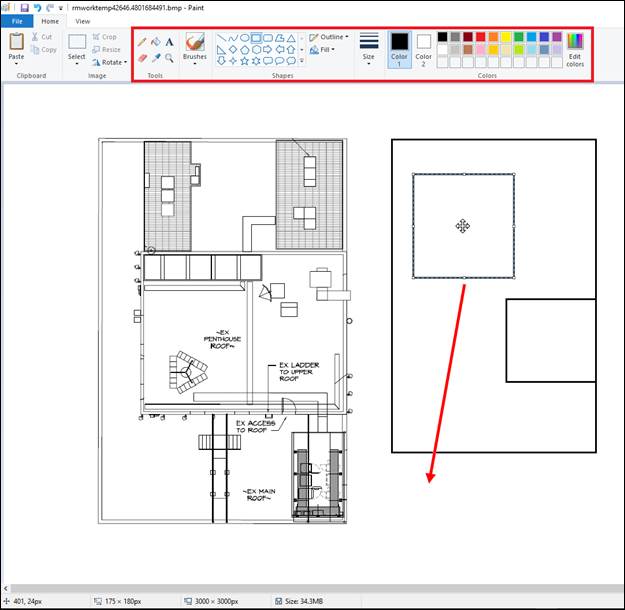
Figure 3.2.15 Drawing Options
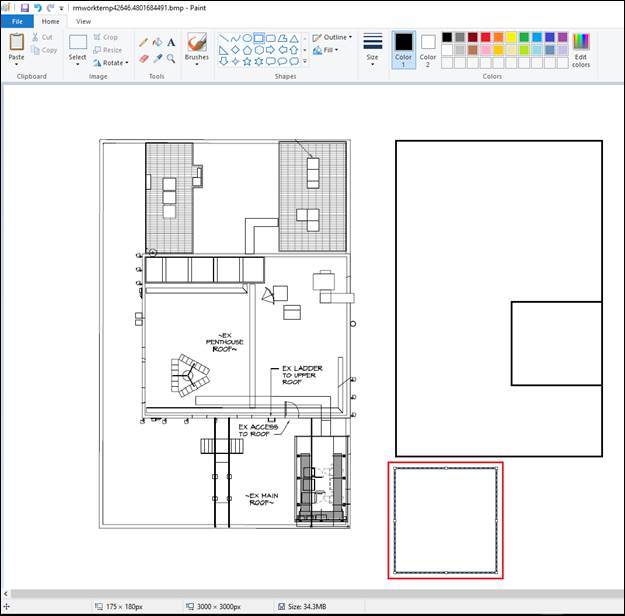
Figure 3.2.16 Drawing Additional Items
Once satisfied with the addition of the new items click the Save button in Paint and close the program. All the changes made in Paint will transpose to RoofMaster™.
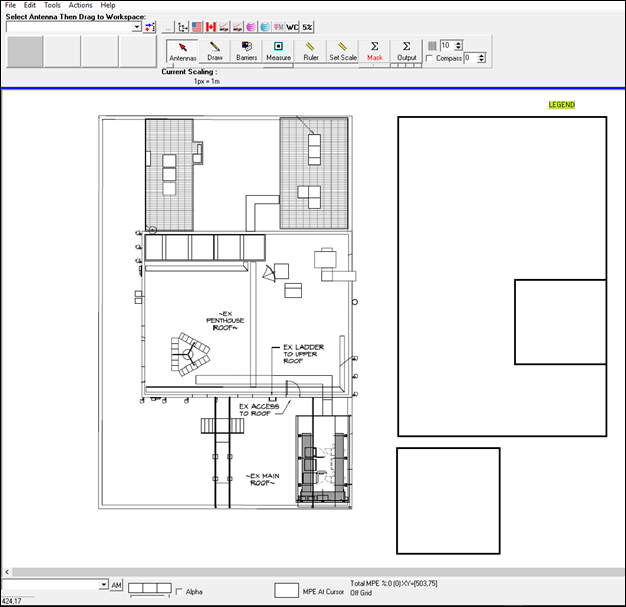
Figure 3.2.17 Example Adding Items Saved
Use the External Drawing Tool to move items.
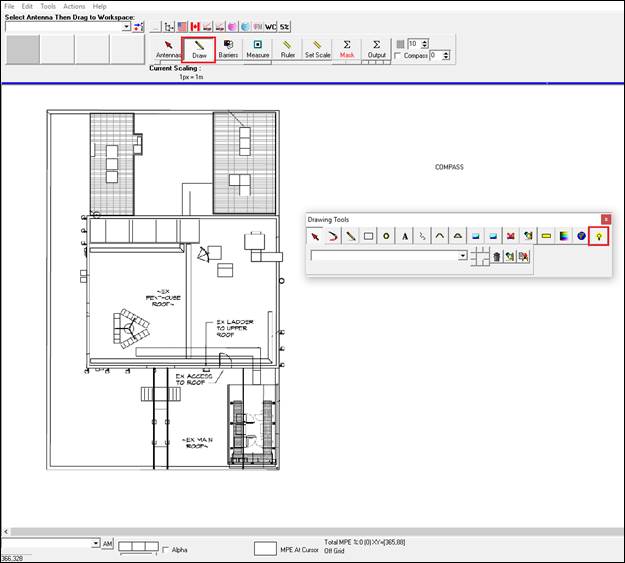
Figure 3.2.18 Example Moving Item(s)
Once inside Paint click the Select tool and use the selection tools to clip the area you wish to move.

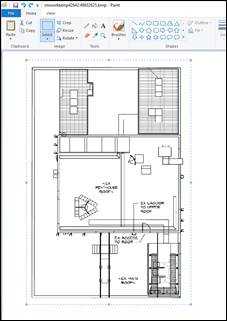
Figure 3.2.19 Item Selection
Next click and slide the site image into the new desired position.
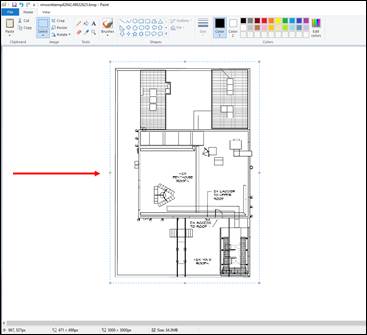
Figure 3.2.20 Example Moved Item(s)
Once satisfied with the new position click the Save button in Paint and close the program. All the changes made in Paint will transpose to RoofMaster™.

Figure 3.2.21 Example Moved Item(s) Saved
3.3. Antennas
Antenna Library
RoofMasterTM includes an antenna library capable of storing as many antennas as required. The antenna library comes preloaded with a selection of commonly used antennas.
Detailed pattern information can be reviewed through the antenna library menu that is available under the Tools main menu item.
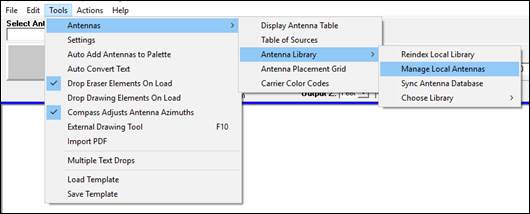
Figure 3.3.1 Antenna Menu
Antennas patterns can be reviewed and edited if needed.
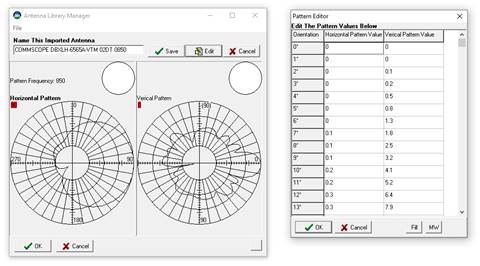
Figure 3.3.2 Antenna Edit
Antenna patterns can be obtained from a Manufacturer and added to RoofMaster™ via the antenna library file menu or by dragging a supported antenna file (planet, vwa, ant. other formats can be made readable on request) into the RoofMaster™ workspace from its file location.


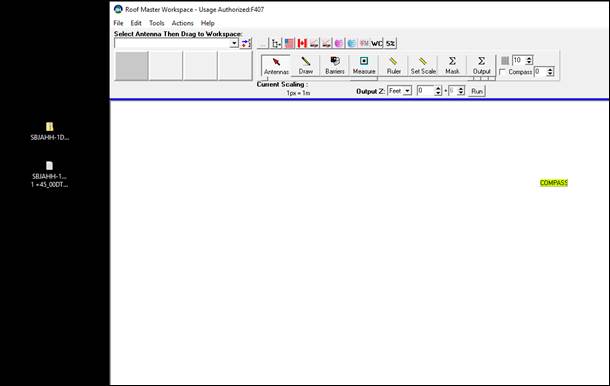
Figure 3.3.3 Manufacturer Import
After the antenna patterns have been placed onto the workspace RoofMaster will re-index the local library to account for the new antennas.
![]()
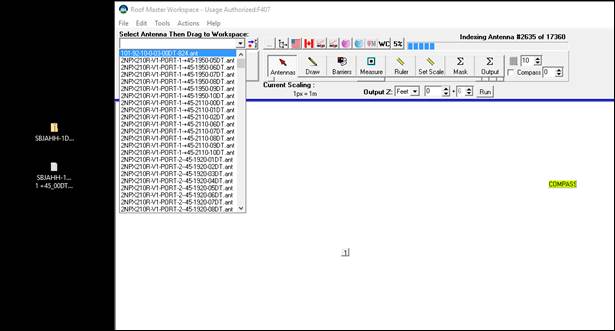
Figure 3.3.4 Antenna Library Indexing
Once the library’s antennas have been re-indexed the local library will convert the antenna pattern to an ant file and be ready to use during the current session and future sessions.
![]()

Figure 3.3.5 Local Antenna Library
Additionally, antenna library updates are available from the Sync Antenna Database utility.
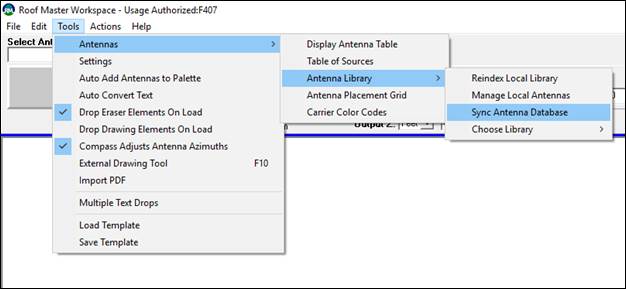
Figure 3.3.6 Antenna Sync Menu
If connected to the Internet, the utility is capable of contacting the Waterford Consultants antenna library server and comparing the local library to the server library. There are options to download a selected antenna or all of the antenna patterns.
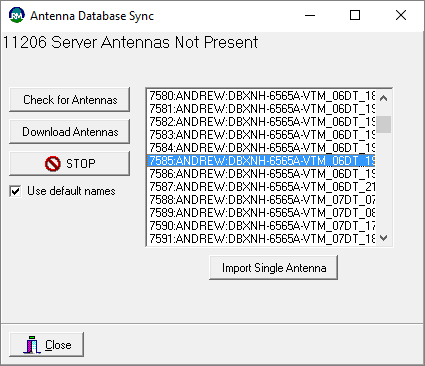
Figure 3.3.7 Antenna Database Utility
|
Note: An important feature of RoofMasterTM is that all projects are stored complete with the antenna pattern files used to create them. If a RoofMasterTM project file containing antennas patterns not present in the local library is opened, RoofMasterTM will still be able to open that project function normally since the antenna patterns are actually embedded in the project files. |
Adding to Workspace
Antennas can be added to the workspace several different ways. Start by clicking the Antennas button to enter the Antenna Mode.

Figure 3.3.8 Antenna Mode Button
The fastest way to access the antenna library is to
click on the antenna library button ![]() on the RoofMasterTM main
screen. A tree view of antenna patterns organized by manufacturer will be
displayed.
on the RoofMasterTM main
screen. A tree view of antenna patterns organized by manufacturer will be
displayed.
![]()
![]()
![]()
![]()
![]()

Figure 3.3.9 Antenna Palette
Selecting an antenna and clicking OK will add that antenna pattern to one of the four antenna palette areas. Patterns from the palette areas can be dragged onto the workspace below and subsequently configured.
![]()
![]()
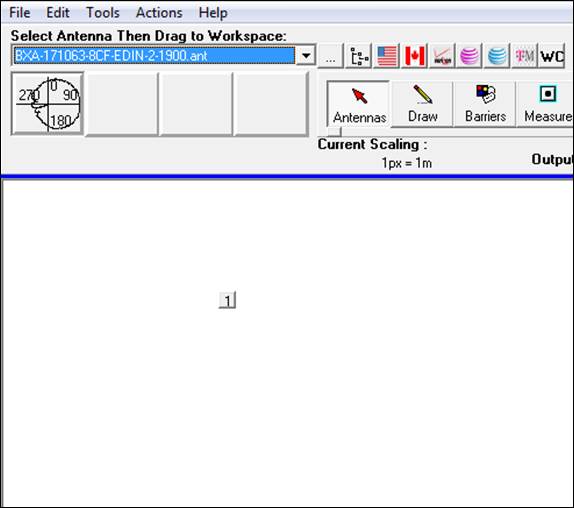
Figure 3.3.10 Antenna Placement
Antennas can be selected from the drop down antenna menu and scrolling to the desired antenna. The antennas will display in numerical and alphabetical order.
![]()

Figure 3.3.11 Drop Down Menu
The search field can be used to type out the antenna model name and then loaded into the palette by clicking the blue arrow button.
![]()
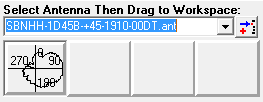
Figure 3.3.12 Search Field
Antennas can also be selected or edited after being placed on to the RoofMasterTM workspace. Right click on the Antenna Icon and choose “Edit” to prompt the Antenna Details Box.
![]()
![]()

Click
the Select Pattern button to choose a new antenna and click OK
Figure 3.3.13 Antenna Details
Antennas can be added by copying an existing antenna and pasting into the RoofMasterTM workspace. Right click the antenna you wish to copy and select Copy. Then right click another area inside the RoofMasterTM workspace and select Paste.
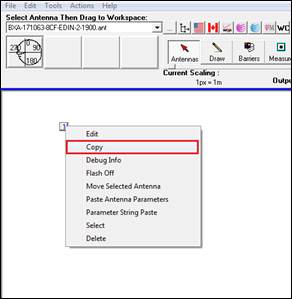

Figure 3.3.14 Copy and Paste Antennas
|
Note: All copied antennas parameters are pasted into the new antenna. |
Antenna Information can be copied from any antenna and placed into another antenna already placed on the workspace.
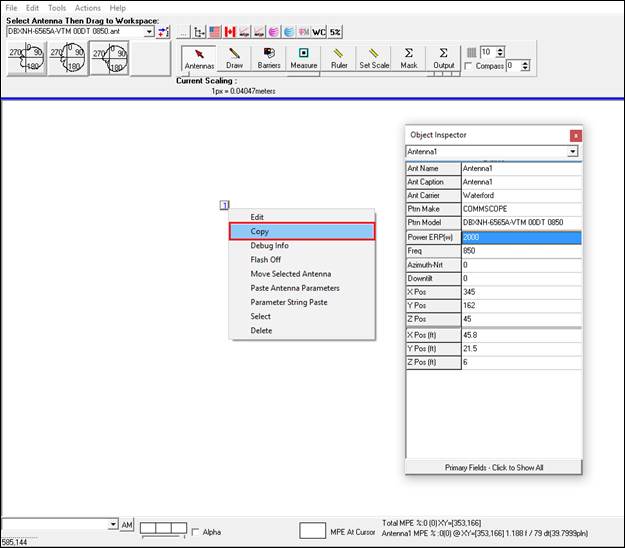
Figure 3.3.15 Copy Antenna Parameters
Next right click on the antenna you wish to transpose the information into and select Paste Antenna Parameters.
Once you click the antenna icon again all of the information will display in the Object Inspector showing the transfer of data.

Figure 3.3.16 Paste Antenna Parameters
Note:
All Information will transfer over except the X and Y value. Double check
your antennas to see if the proper azimuth has been entered if copying and
pasting between different sectors.
Antennas can also be added the RoofMasterTM workspace using the Microsoft Excel Antenna Import Sheet.
Fill out the following columns: Carrier, Antenna Number, Emitter Number, Pattern, Frequency, Power, Length, Azimuth, Mechanical Downtilt, Height(ft), X(ft), Y(ft)

Figure 3.3.17 Antenna Import Sheet
Save the Microsoft Excel Antenna Import file.
Next, open RoofMasterTM and drag the Microsoft Excel Antenna Import Sheet file directly into the RoofMasterTM workspace from its file location.
![]()
![]()

Figure 3.3.18 Drag and Drop Antenna Import File
Note:
The antenna’s naming convention must match the naming convention found in
your RoofMaster’s local library
An Antenna Placement Entry box will automatically prompt when you drag the document into RoofMasterTM. Select “OK” to confirm and the antennas will populate at their specified positions on the drawing. Default positions, top left corner, will be used if no coordinates are provided.

Figure 3.3.19 Antenna Import Details
The Microsoft Excel Antenna Import sheet can also be imported but selecting File > Open Antenna Input Sheet.

Figure 3.3.20 Antenna Input Sheet
Next follow the file path to where the Excel file is located on local computer and click Open.
![]()
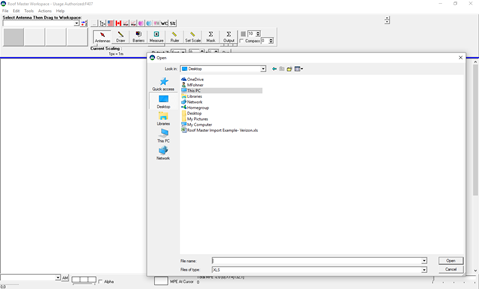
Figure 3.3.21 File Path
The Antenna Placement Entry prompt will appear and display the information found in the excel sheet.
![]()

Figure 3.3.22 Antenna Import Details
Click “OK” to confirm and the antennas will be placed on the workspace containing the parameters from the excel sheet.
![]()
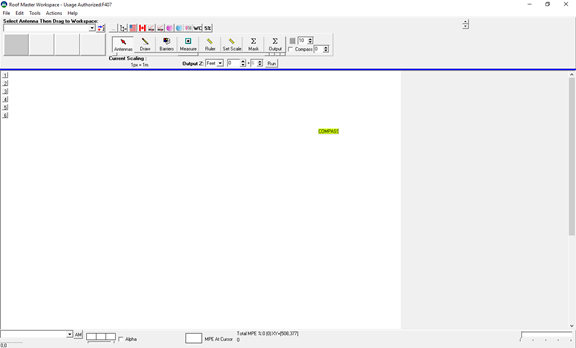
Figure 3.3.21 Antennas Added to Workspace
Antenna Details
Right click an antenna and select Edit to display the Antenna Details screen. Use the Antenna Details screen to add RF emitters or edit operator, antenna model, power, frequency, azimuth, radiation center height and downtilt. Click “OK” when finished entering in the data.
|
Calculator: Used to calculate the antenna’s TPO, dBm, Loss, ERP and EiRP power |
Antenna Model: Click the “Select Pattern” button to change the antenna model |
Editing an Emitter: Use the “drop down arrow” to change to a different antenna emitter |
|
Z Height: Use the up and down arrows to increase and decrease the antennas RAD center
|
|
Adding an Emitter: To add another emitter to an antenna, click the (+) sign and fill out antenna information
|
|
Power: Enter the antennas final output power in either: ERP or EiRP
|
Carrier: Use the drop down menu to select a carrier to color code and identify which operator the antenna is associated with.
|
|
|
Orientation (Azimuth): Enter the antennas orientation under the Orientation (North) field
|
Gain: Represents the antenna patterns gain in dBd and dBi
|
|
|
Swap: Click this button to exchange the horizontal and vertical pattern. Useful for antennas mounted on side.
|
Frequency: Represents the antenna pattern’s operating band
|
|
|
Invert: Click to this button to invert the horizontal or vertical patterns. |
Length (M): Enter the aperture length of the antenna in meters (example 4 feet equals 1.23) or type it in as feet (4’= 4f) to convert to metric units |
Downtilt: Field for entering the antenna’s mechanical downtilt in degrees
|

Figure 3.3.22 Antennas Details
RF Calculator
The RF Calculator gives the user the ability to calculate the power for the antenna through the following fields:
TPO, Channel Count, Line Loss dB, Line Length
The calculator uses those parameters to calculate ERP and EiRP Watts and dBm
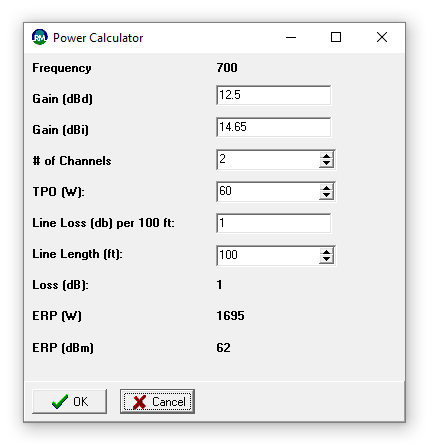
Figure 3.3.24 Calculator
After selecting OK, the final ERP or EiRP power calculated will be assigned to the selected antenna.
Object Inspector
The Object Inspector in RoofMasterTM can also be used to input antenna parameters. Clicking an antenna or the antenna mode button will display the object inspector. Pressing F11 will also prompt the Object Inspector if closed.
|
Orientation (Azimuth): Enter the antennas orientation under the Orientation (North) field
|
|
Power: Enter the antennas final output power in either: ERP or EiRP
|
|
Downtilt: Field for entering the antenna’s mechanical downtilt in degrees
|
Frequency: Represents the antenna patterns operating band |
|
|
Z Height: Use the up and down arrows to increase and decrease the antennas RAD center. |
Moving the Antenna: Using the X & Y you can input a higher or lower number to position the antenna into a new spot |
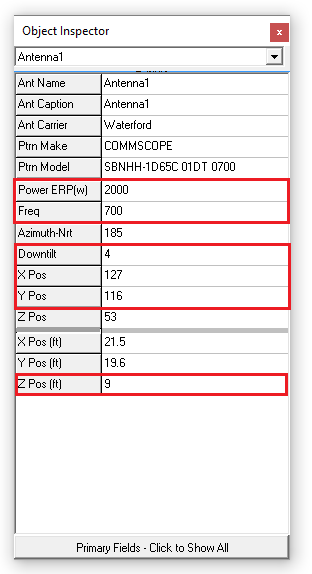
Figure 3.3.23 Object Inspector
Table of Sources
The Table of Sources allows users to view and manipulate a site's antenna inventory in a tabular view, styled after Excel.
To access the Table of Sources, go to Tools and select Table of Sources or press the F7 key.

Figure 3.3.25 Launching Table of Sources
Once the table has been displayed, here are some of the antenna parameters fields that can be changed:
The Antenna Name, Emitter, Antenna Caption, Antenna Carrier, Antenna Model, Power, Frequency, Azimuth, Mechanical DT and X, Y, Z Position in pixels, meters & feet can all be changed.
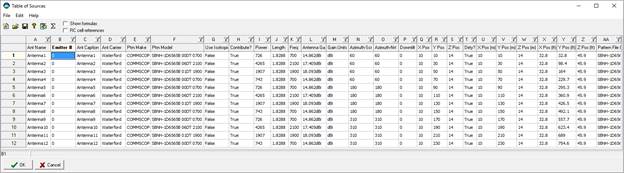
Figure 3.3.26 Table of Sources
To change a field simply click the desired cell and type in the new parameter

Figure 3.3.27 Editing Cells
![]()
To change an antenna model right click in the “pattern model” field and click “select antenna pattern”.
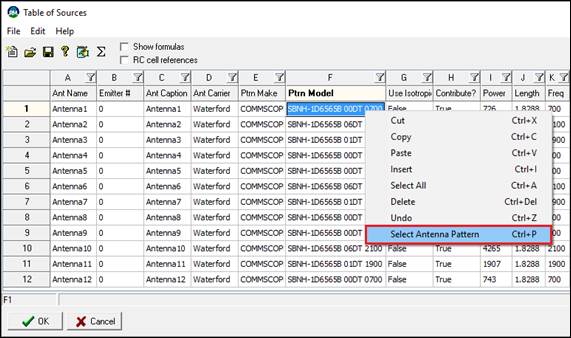
Figure 3.3.28 Changing Patterns
You will now have the option to select the new pattern from the manufacturer tree view
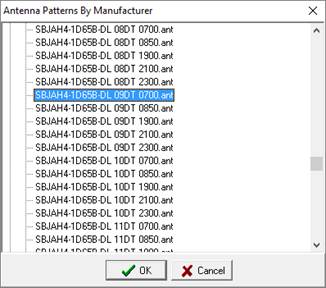
Figure 3.3.29 Tree View
Antenna Information can also be cut, copy and pasted, deleted and added through the insert function. To execute any of these features highlight the row and right click, then select the desired choice.
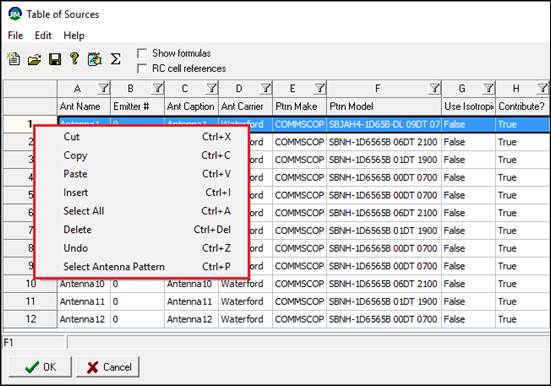
Figure 3.3.30 Additional Options
![]()
Columns can be filtered and sorted to quickly update a selection of antennas. To sort click the Filter icon and choosing the desired choice.

Figure 3.3.31 Filtering
Once all of the desired changes have been made click “OK” to close the table of sources.
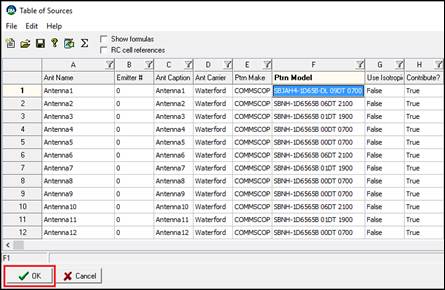
Figure 3.3.32 Finalizing Table of Sources
Next select “Yes” to apply all changes. To confirm the changes, view the Object Inspector or Antenna Details to see the new updates.

Figure 3.3.33 Applying Changes
3.4 Additional Tools/Features
Carrier Color Code
This feature will allow you to design a customized color scheme and naming convention for the antennas.
Select Tools > Antennas > Carrier Color Codes
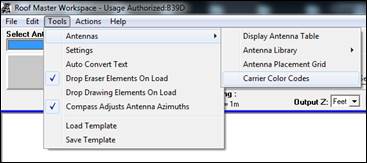
Figure 3.4.1 Carrier Color Codes
Enter the Naming Convention or Technology and then click inside the color circle to open the Color Edit Box to select a new color.
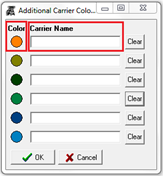
Figure 3.4.2 Additional Carrier Color Codes
Select Define Custom Colors >> to display the RGB fields to set a custom color.

Figure 3.4.3 Color Selection
Drop Text
To add a Text box, right click anywhere on the workspace and choose Drop Text. A text field will prompt and text can be entered. Once finished click “OK”. The Text object can now be moved into place.
![]()

Figure 3.4.4 Drop Text
![]()
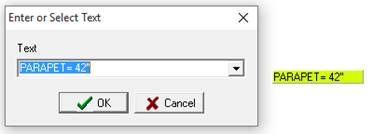
Figure 3.4.5 Text Entry
Pre-Loaded Texts can also be selected from the drop down list and placed onto the workspace
If the text field needs to be edited right click the text box that needs to be revised and choose edit.
To delete the text right click the box and select delete.
Multiple Text Drop
Multiple texts can be dropped onto the work space at one time by selecting Tools > Multiple Text Drops. This will prompt a text list where several texts can be selected and added to the workspace.
|
|
|

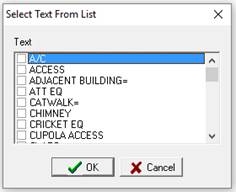
Figure 3.4.6 Multiple Text Drop
Anchors
To place an Anchor, make sure the Antenna button is clicked. Than right click anywhere on the workspace and choose Drop Anchor. Once the anchor has been placed the anchor object can be moved into position.
![]()
![]()
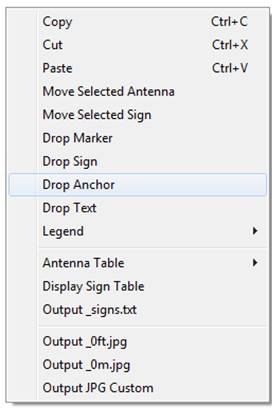
Figure 3.4.7 Anchors
To delete an anchor point right click the anchor icon and select delete.
Measurements
To add a Measurement, click the Measure button than click anywhere in workspace to drop a number. Once you click again it will numerically drop the next number in succession.
Figure 3.4.8 Measure Mode
![]()
If a measurement needs to be removed right click and select delete to remove
To add a Multiple Measurement text box, click the rectangle below the Measure Button until it indicates Multi M. Click anywhere in the drawing area to drop the text box. Once the box has been dropped right click and select edit to prompt edit box.
![]()

![]()
![]()
![]()
![]()

Figure 3.4.9 Multiline Measurement
If the multiple measurement text box needs to be removed right click and select delete to remove.
The measurement box becomes dynamic as lines are left blank.
Arrow Line
To add an Arrow Line click the rectangle below the Measure Button until it indicates Arrow Line. Once the Arrow Line has been selected right click anywhere in the drawing area and select Add Arrow Line. The arrow can then be manipulated by using the way points to increase or decrease the size.
![]()
![]()

Figure 3.4.10 Arrow Line
If the Arrow Line needs to be removed right click and select delete to remove
Zoom
The zoom feature can be used when the Antennas, Barrier, Measurement, Ruler, Set Scale, and Mask Modes have been clicked. In the bottom right corner click and drag the slider to the right to zoom up to 4x.
![]()
![]()
![]()
![]()

![]()
![]()
![]()
![]()

Example: 2x Zoom
Material Attenuation
RoofMaster has the ability to add building materials that can calculate loss created as the RF passes through the material when performing an analysis. To use this feature, click the bar below the Measurement Button until you cycle to Materials.
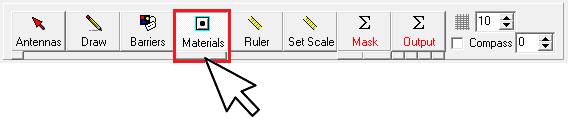
Figure 3.4.11 Material Attenuation
Next right click inside the workspace to add a solid material. Click the prompt box Add Solid Material to open the Material Details.
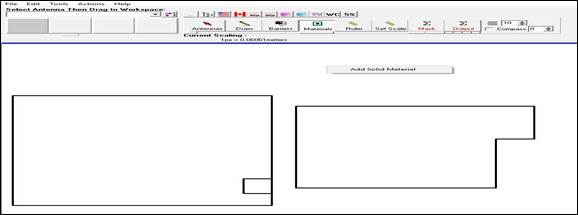
Figure 3.4.12 Adding Solid Material
Once the Material Details box appears enter the Object Name (Example: Parapet) then use the drop down list to obtain the Object Material Type needed (Example: Concrete Wall- 10db)

Figure 3.4.13 Material Details
Once the proper materials have been selected click and drag out your attenuation line, using the yellow and green waypoints, overtop of the area that represents that Solid Material on site.
Note: Multiple Solid Materials can be dropped to represent several areas as well as different material types.
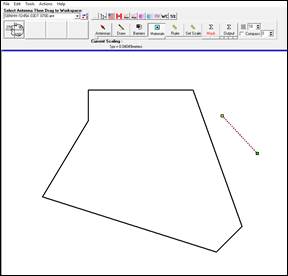

Figure 3.4.14 Attenuation Object Line
To edit or delete the material right click the
attenuation line and select Edit to open the Material Details or select Delete
to remove the line from the workspace.
Once all of the Solid Materials have been placed select the Model that incorporates Material Attenuation, Sula 09 Material Attenuation, and click run. To change the Model, click the small box on the far left under the Output Button. The analysis will now display with the material attenuation considered.
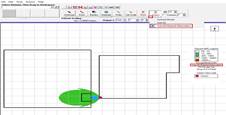
Figure 3.4.15 Material Attenuation Model
Modeling without Attenuation considered
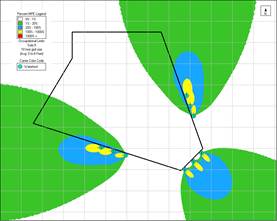
Figure 3.4.16 Molded with No Attenuation
Modeling with attenuation considered

Figure 3.4.17 Modeled with Attenuation Added
Ruler Tool
The Ruler tool can be used to examine distances and angles between various points. RF output and other elements remain on screen when using the Ruler tool. Antenna orientation lines also become more prominent during use.

Figure 3.4.18 Ruler Mode
Click the Ruler button to enter the Ruler mode. Next click and drag out the RED ruler line to measure a distance on the workspace. The distance is then displayed on the tool bar.
Example: The distance is 199 pixels, 6.903 meters, 22.6 feet long and the line was drawn facing 90°.
![]()
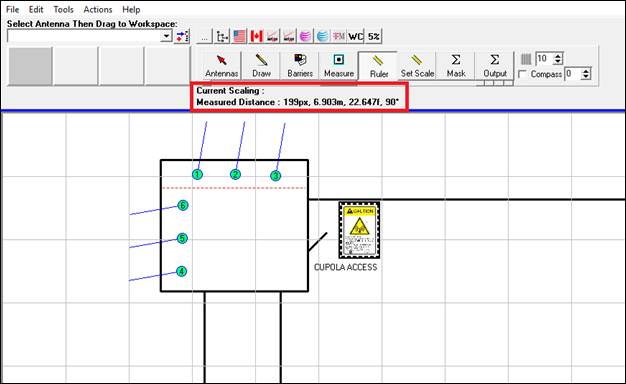
Figure 3.4.19 Measured Results
To keep the measured line visible during use, hold the shift key as you click and drag out the line. After dragging out the line unclick then release the shift key. This will allow the ruler line to remain on the workspace and become dynamic as you hover in and out. To reset the ruler, click again in the workspace.

Figure 3.4.20 Visible Line
4. Analysis and Review
To perform an MPE predictive analysis at a site, the following parameters must be specified
Antennas are ascribed to operators in the antenna properties and can be included in an analysis based on Output Selection settings. From > Action Menu > Output Selection (F9), carriers with selected checkboxes will be included.

Figure 4.1 Select Layers and Carrier Output
RoofMasterTM determines the predicted MPE at each grid point. The Output Z setting specifies the elevation at which the study plane is analyzed. This field is enabled in Output mode and may be entered in English or Metric units.
![]()
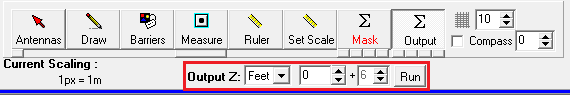
![]()
Figure 4.2 Select Output Z Setting

Figure
4.3 Output in Metric
Study Plane Description: This scenario consists of three walkable surfaces, main level, penthouse level and ground. The study plane is the base elevation of the exposure zone a person could stand.

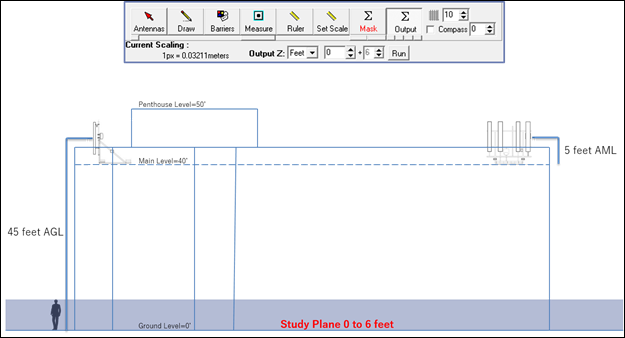
Figure 4.4 Ground
Level Study


Figure 4.5 Main
Level Study

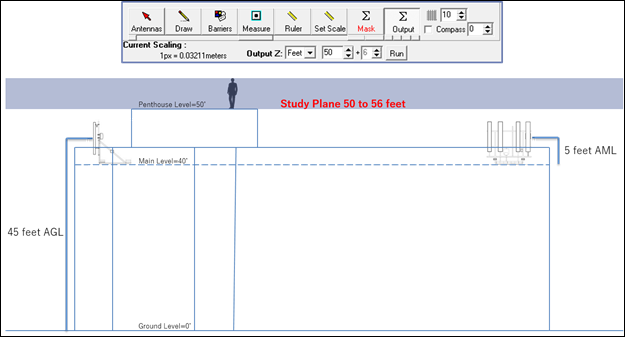
Figure 4.6 Penthouse
Level Study
The analysis results will be depicted as a percentage of the applicable MPE limits. From > Tools Menu > Settings, the MPE Limits tab enables the display to report %MPE according to the Public or Occupational limits and according to specified ranges.
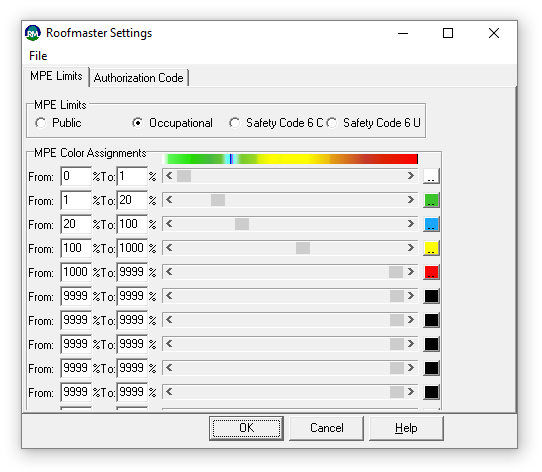
Figure 4.7 Settings
Pre-configured MPE thresholds can be selected from the Carrier buttons located above the tool bar.
The analysis can be restricted to a selected portion of the workplace by using the Mask tool. After clicking the Mask button, click and drag out a selection within the workspace. RoofMasterTM will frame this area and exclude analysis and content display outside of it.

Figure 4.8 Mask Mode
Starting with the cursor in the top left area of the screen click and drag down to the bottom right of the image.

Figure 4.9 Example Mask
The user can click the Output button to see your selected Mask area.
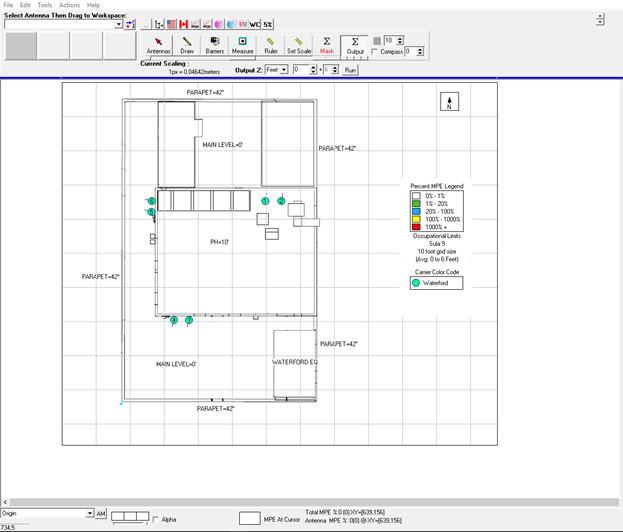
Figure 4.10 Example Masked Area
![]()
Non-Masked Output Plot
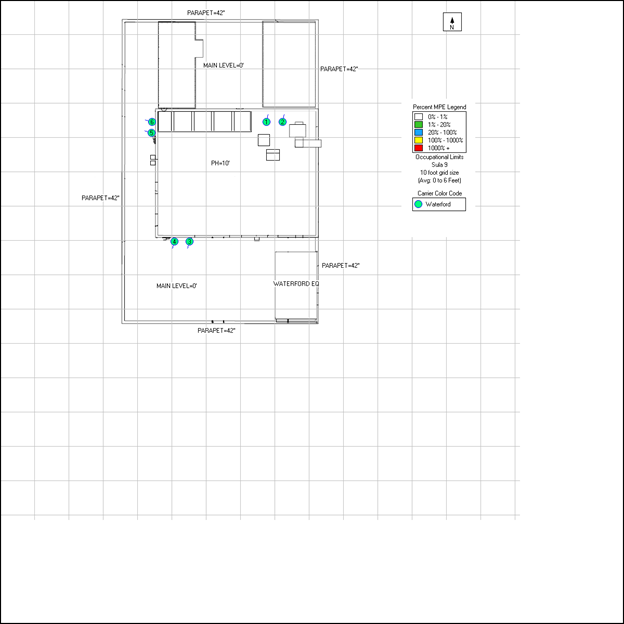
Figure 4.11 Example Unmasked Plot
Masked Output Plot

Figure 4.12 Example Masked Plot
Model Selection
RoofMaster’s default model when the software is initially opened is set to Sula09. To change the Model, click the small box on the far left under the Output Button.
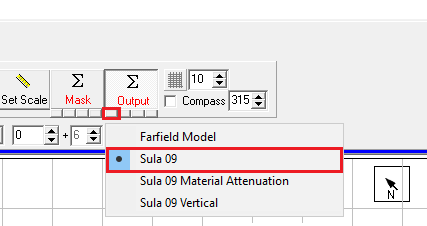
Figure 4.13 Model Selection
The analysis may be initiated by entering the desired study height and clicking the Run button.
![]()
![]()
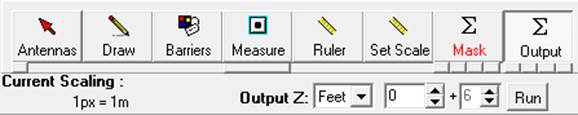
Figure 4.14 Study Height & Analysis
![]()
The predicted MPE is displayed according to the Settings thresholds. The total MPE at any given location is determined by moving the mouse within the workspace. This value is displayed on the lower tool bar. The contribution for any antenna may be obtained by passing the mouse over the antenna of interest. The MPE for this antenna is displayed below the total MPE report.
![]()
![]()
![]()
![]()
![]()
![]()
![]()
![]()
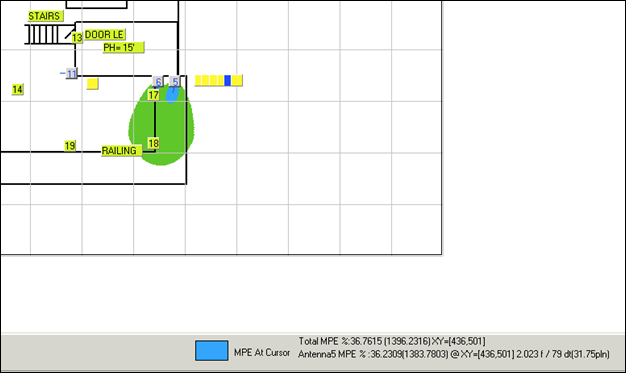
Figure 4.15 Output Display
Legend
The legend displays the project’s MPE thresholds, the model that was used to complete the analysis, grid size, study plane height, antenna color codes and mitigation items that have been selected on, under the Output Selections feature.

Figure 4.16 Legend
To move the legend into a new position on the workspace, enter the Antenna or Output Mode then click and drag the LEGEND widget to the desired location.

Alpha Bleed Control
Use the Alpha Bleed Control button to render lost drawings lines when low threshold settings are a darker color.
![]()
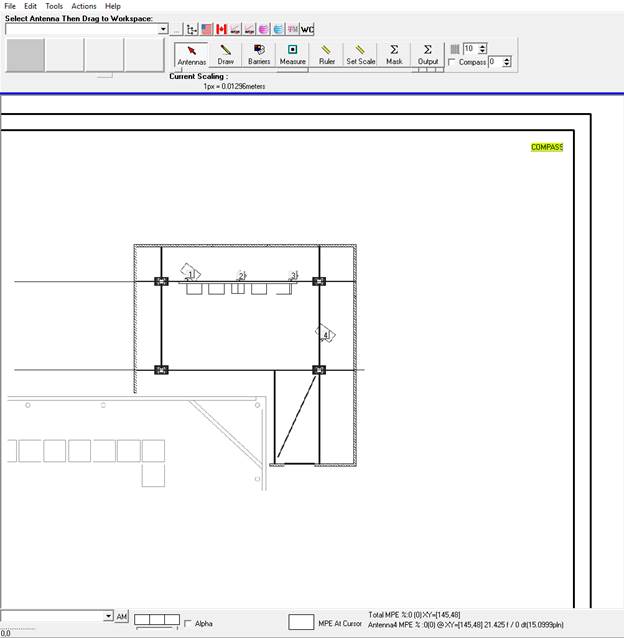
Figure 4.17 Example Alpha Bleed
![]()
![]()
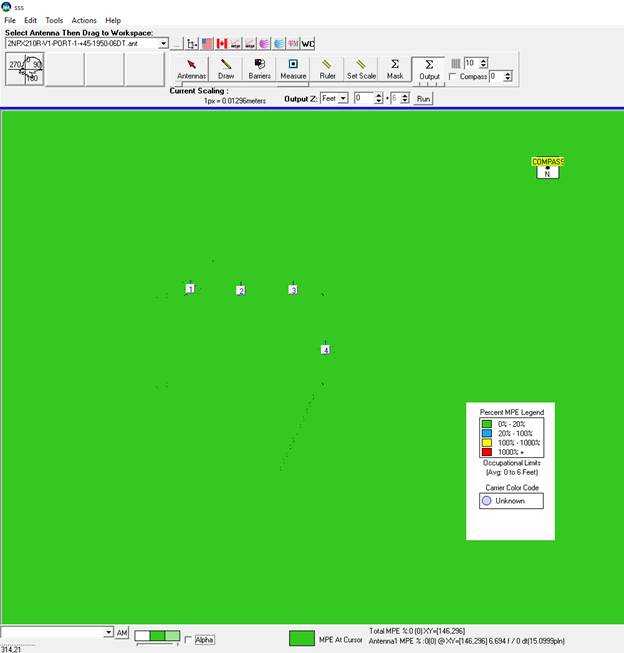
Figure 4.18 Example Alpha Bleed Disabled
Click the Alpha box located on the bottom tool bar to allow lines to become more prominent.
![]()
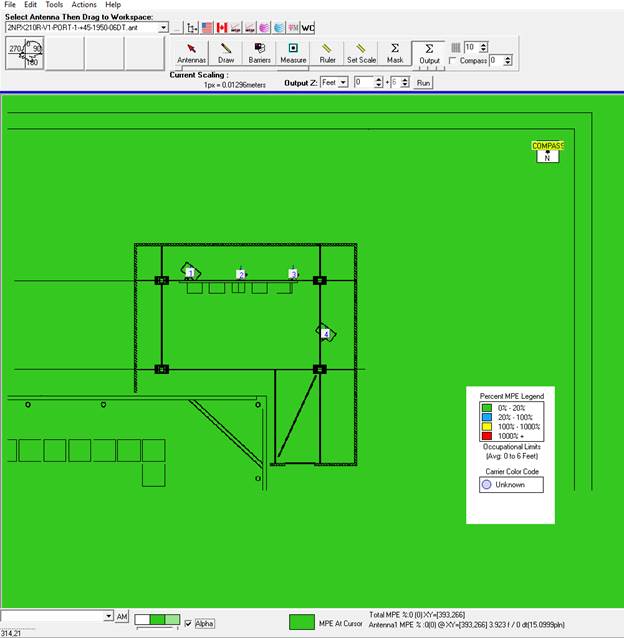
Figure 4.19 Example Alpha Bleed Enabled
Max MPE Location
To locate the highest Max MPE for the Current Study Plane (Z Height) Right click inside the workspace and select Legend > Show MPE Max. A red box will appear where the highest measurement is located with the Max Value recorded in the Legend.
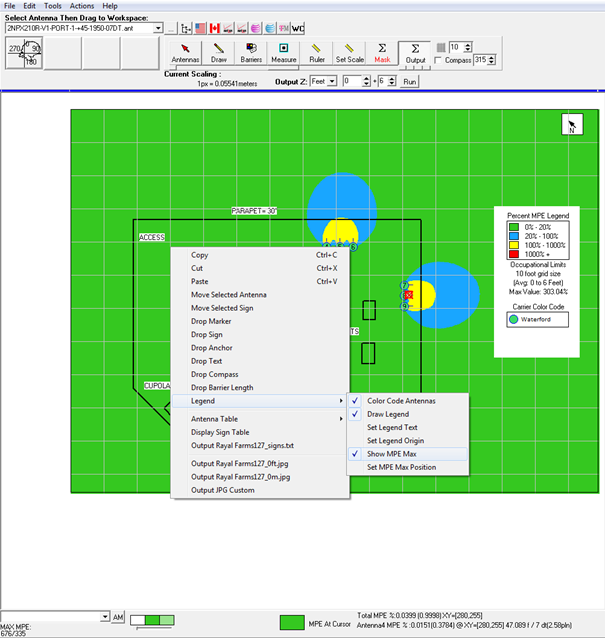
Figure 4.20 Max MPE Reading
Specific Max MPE location
To capture the Max MPE anywhere on site make sure the Show MPE Max is checked then right click in the desired location to find the Max MPE. A red box will appear where the user right clicked and the Max Value will be recorded in the Legend.

Figure 4.21 Specific Location MPE Reading
Workspace results may be exported as image files by right clicking in the workspace area. The output menu appears at the bottom of the option list. Default filenames are exported to the Projects subdirectory under the RoofMasterTM installation.
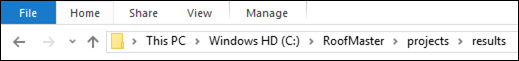
Figure 4.22 Results Folder File Path
![]()
![]()
![]()
![]()

Figure 4.23 Saving Output
|
Note: The file path and filename will be automatically copied to the clipboard and can then be pasted into another program to facilitate opening the output jpg file in that program. |
Graphics Option
Modeling Outputs can be captured as JPG, PNG or PDF files. To change the output type, select Actions > Graphic Options > JPG, PNG or PDF

Figure 4.24 Graphic Options
Antenna Table
To display the Antenna Table in RoofMaster™ press F8 or right click in the workspace and choose Antenna Table > Display Antenna Table.
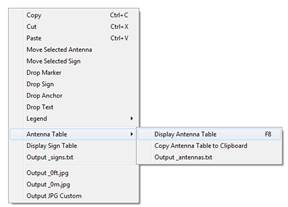
Figure 4.25 Antenna Table Menu
To export the antenna table, select Copy > OK. The antenna table can now be pasted into a Word doc or an Excel spreadsheet.
![]()
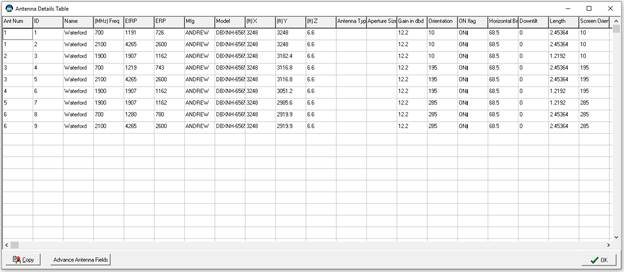
Figure 4.26 Antenna Table Display
5. Mitigation Design
RoofMasterTM allows for site mitigation design using the placement of signs and barriers on the site.
5.1 Signs
To drop a sign in the workspace, right click anywhere in the workspace and select Drop Sign. The Sign Information Box will open immediately after dropping a sign.
![]()
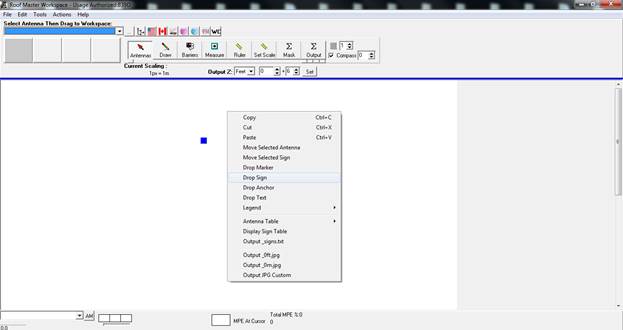
Figure 5.1.1 Drop Sign
|
Using the X & Y fields the user can input a higher or lower number to reposition the sign into a new spot on the workspace
|
|
Sign Label: Enter the signs location or purpose (Example: Alpha Sector)
|
|
Carrier: Select the appropriate carrier the sign belongs to
|
||
|
Sign Status: Using the drop down menu, select the Signs Status:
Existing
Proposed
Installed
|
Sign Type: Choose the desired sign from a drop down list consisting of different FCC signs
|
|
|
Sign Indicator: Create an arrow extending from the sign. The indicator and length can be adjusted to the desired direction and size |
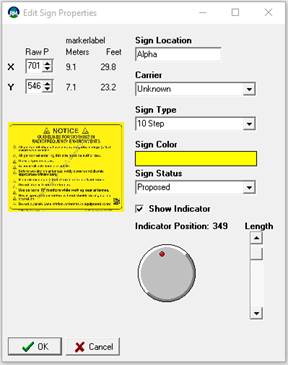
Figure 5.1.2 Sign Properties
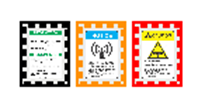
Figure 5.1.3 Sign Glyphs
|
Note: If a sign needs to be changed or deleted right click on the sign icon and select edit or delete. |
Sign sizes can be adjusted by going to Actions > Signs Size > the selecting the desired size. RoofMaster’s default size is extra small.

Figure 5.1.4 Sign Size Selection
Sign Indicator
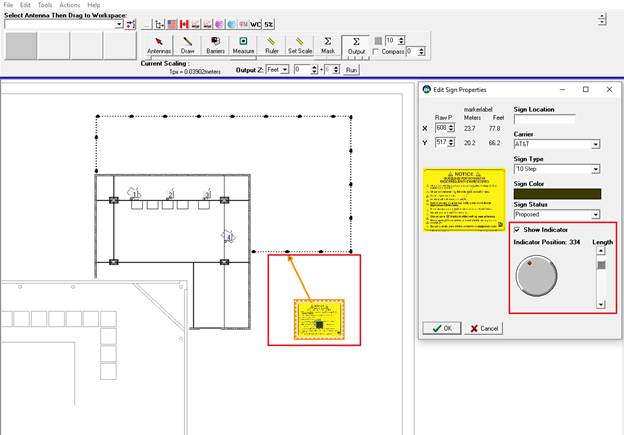
Figure 5.1.5 Sign Indicator
Use the Length slider to increase and decrease the length of the arrow extending from the sign
Rotate the Indicator Position to maneuver the arrow to the desired pointing direction.
The Indicator can be toggled on off as needed.
5.2 Barriers
To place a barrier, make sure the Barrier button is clicked and right click anywhere on the plot and choose Existing, Proposed or Installed. Use the way points to increase and decrease the length to the desired size and move into position.
|
|
|
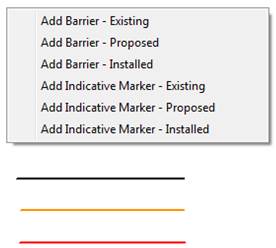
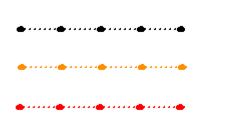
Figure 5.2.1 Barrier Types
Different stanchion lengths can be selected to show different post distances. Practical barriers design should end with a stanchion pole. RoofMaster’s default stanchion length is set to 8’.
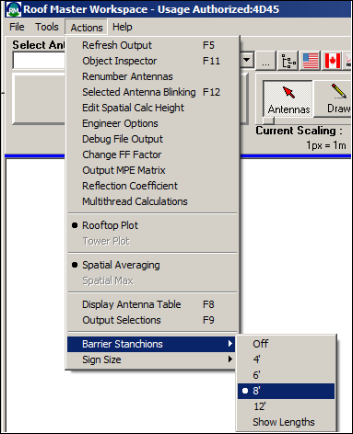
Figure 5.2.2 Stanchion Spacing
To adjust the stanchion distances, select > Actions > Barrier Stanchions and select the desired stanchion distance.
To delete a barrier right click the barrier to be removed and select delete
To Utilize the Barrier/Indicative Marking Display Table right click and select Display Barrier Table to track linear feet, stanchions and segments utilized throughout the site.

Figure 5.2.3 Barrier Table Export
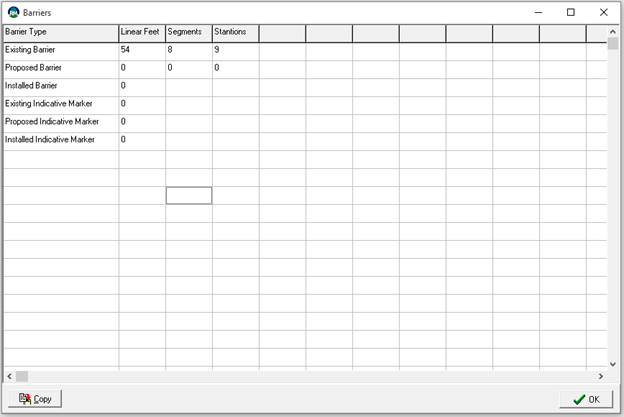
Figure 5.2.4 Barrier Table Display
5.3 Compliance Wizard
The compliance wizard allows the user to create a Word compatible compliance document that contains the desired plot elevations, antenna table, sign table, barrier table and other notes all in one step.
After entering all of the necessary antenna information and applying the appropriate mitigation the report can be created by going to Compliance Tools > and selecting Compliance Wizard.

Figure 5.3.1 Launching Compliance Wizard
Once the Compliance Wizard prompt appears, fill in the site’s name, address, structure type and preparer information.

Figure 5.3.2 Compliance Wizard
Next set the different Output Levels by entering the desired study plane height then clicking the +Add Level button.

Figure 5.3.3 Output Level Selection
To remove a study plane level, click and highlight the level you wish to remove and click Remove Level.

Figure 5.3.4 Remove Level
Once the levels have been entered read each question and click the box if it applies to the site. Leave unchecked if it does not apply to the site. The Notes section can be used to add any additional or pertinent information that is needed for the report. After filling out all of the fields click the Review button to generate the report.

Figure 5.3.5 Notes
Example Report:
Compliance Report: Practice Site 1/05/2017
|
Site Name: |
Practice Site |
|
Address: |
201 Loudoun Street SE Suite 300 |
|
City: |
Leesburg |
|
State: |
VA |
|
Zip Code: |
20175 |
|
Structure Type: |
Rooftop |
Preparer Information:
Preparer: Matt Fohner
RoofMaster Version: 12.4.27.16
Email: mattf@waterfordconsultants.com
Region: USA
Supervisor Email: mschipani@waterfordconsultants.com
Signage: Signage is viewable from the front, back and sides of the antenna sectors
Access: ALL access points are either locked or alarmed
Signs:
|
Number |
Caption |
Carrier |
Type |
Status |
|
1 |
Alpha |
Unknown |
`Blue Notice |
Proposed |
|
2 |
Alpha |
Unknown |
`Blue Notice |
Proposed |
|
3 |
Beta |
Unknown |
`Blue Notice |
Installed |
|
4 |
Beta |
Unknown |
`Blue Notice |
Installed |
|
5 |
Gamma |
Unknown |
`Yellow Caution |
Existing |
|
6 |
Gamma |
Unknown |
`Yellow Caution |
Existing |
Barriers:
|
Barrier Type |
Linear Feet |
Segments |
Stanchions |
|
Existing Barrier |
32 |
|
|
|
Proposed Barrier |
9 |
1 |
3 |
|
Installed Barrier |
0 |
|
|
|
Existing Indicative Marker |
0 |
|
|
|
Proposed Indicative Marker |
0 |
|
|
|
Installed Indicative Marker |
0 |
|
|
Antennas:
|
Ant ID |
Carrier |
Ant Model |
Power (Watts ERP) |
Power (Watts EiRP) |
Frequency in MHz |
Height ft |
Azimuth |
|
A:1, E:1 |
Waterford |
COMMSCOPE SBNH-1D6565B 00DT 0700 |
726 |
1191 |
700 |
47 |
60 |
|
A:2, E:1 |
Waterford |
COMMSCOPE SBNH-1D6565B 06DT 2100 |
2600 |
4265 |
2100 |
43.8 |
60 |
|
A:3, E:1 |
Waterford |
COMMSCOPE SBNH-1D6565B 01DT 1900 |
1162 |
1907 |
1900 |
40.8 |
60 |
|
A:4, E:1 |
Waterford |
COMMSCOPE SBNH-1D6565B 00DT 0700 |
743 |
1219 |
700 |
37.8 |
60 |
|
A:5, E:1 |
Waterford |
COMMSCOPE SBNH-1D6565B 00DT 0700 |
726 |
1191 |
700 |
47 |
180 |
|
A:6, E:1 |
Waterford |
COMMSCOPE SBNH-1D6565B 06DT 2100 |
2600 |
4265 |
2100 |
47 |
180 |
|
A:7, E:1 |
Waterford |
COMMSCOPE SBNH-1D6565B 01DT 1900 |
1162 |
1907 |
1900 |
47 |
180 |
|
A:8, E:1 |
Waterford |
COMMSCOPE SBNH-1D6565B 00DT 0700 |
743 |
1219 |
700 |
47 |
180 |
|
A:9, E:1 |
Waterford |
COMMSCOPE SBNH-1D6565B 00DT 0700 |
726 |
1191 |
700 |
47 |
310 |
|
A:10, E:1 |
Waterford |
COMMSCOPE SBNH-1D6565B 06DT 2100 |
2600 |
4265 |
2100 |
47 |
310 |
|
A:11, E:1 |
Waterford |
COMMSCOPE SBNH-1D6565B 01DT 1900 |
1162 |
1907 |
1900 |
47 |
310 |
|
A:12, E:1 |
Waterford |
COMMSCOPE SBNH-1D6565B 00DT 0700 |
743 |
1219 |
700 |
47 |
310 |
Plots:
Plot at 40':
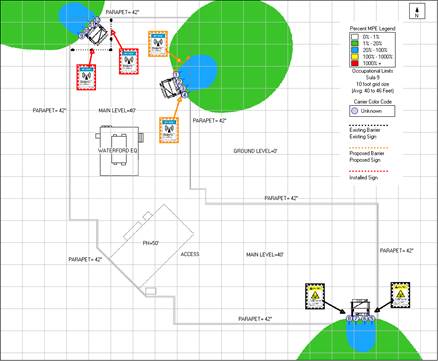
Plot
at 50':
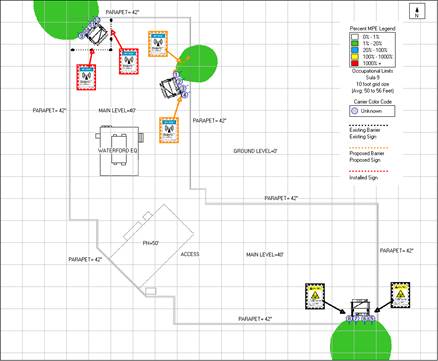
(2) 18 lb weights are need per proposed barrier stantion
6. Sula9 Vertical Mode
The RoofMaster™ Sula9 Vertical Mode feature provides predicted spatial average power density as a percentage of the applicable FCC limits in the elevation plane. The Sula9 model is based on the Cylindrical Model as described in OET 65. Rooftop mode provides a top down view of the RF environment for the specified vertical space that a human may occupy. The Vertical mode depicts exposure conditions in the main beam of the antenna in the elevation plane.
No adjustment to the coordinate system is required to create a scenario for this analysis. However, antenna placement and scaling fixes the antenna centerline in the vertical dimension of the RoofMaster canvas as follows:
|
Coordinates |
Antenna Property |
Rooftop Mode |
Vertical Mode |
|
X |
Latitudinal Position* |
Horizontal offset from left to right of canvas |
Horizontal offset from left to right of canvas |
|
Y |
Longitudinal Position* |
Vertical offset from top to bottom of canvas |
Offset above or below canvas |
|
Z |
Elevation |
Offset above or below canvas |
Vertical offset from top to bottom of canvas |
* For 0 Deg True
The RoofMaster™ Sula9 Vertical mode computes the predicted MPE within the six-foot vertical zone that a person could occupy. The predicted MPE for this zone is depicted at the elevation associated with the center of this zone.
The RoofMaster™ Sula9 model includes RF energy suppression above and below the antenna to simulate the effects of typical vertical antenna pattern nulls. The Sula9 model utilizes a 10 dB power reduction in areas vertically outside of the antenna aperture. An additional 20 dB of suppression is included along the antenna’s zenith and nadir. This feature is utilized in Rooftop and Vertical mode studies.
The MPE prediction is provided for horizontal antenna orientation of 0 and 180 degrees. Drawings or images supportive of the vertical view may be created for the display.
To create a study in Sula9 Vertical Mode import the desired site image into the RoofMaster workspace.
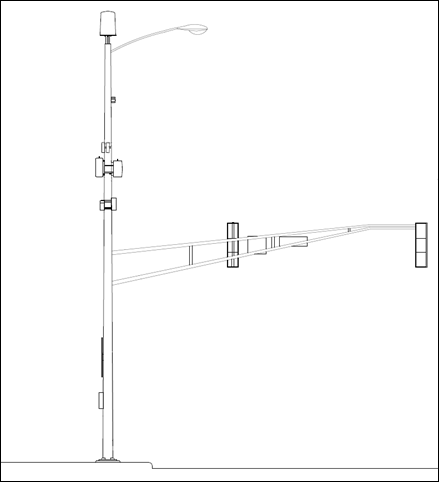
Figure 6.1 Elevation Site Image
After importing the image into RoofMaster the next step will be to set the site’s scale. To begin, click the Set Scale button to enter Scale mode. Next click and drag a Blue line the length of part of the drawing where the linear dimension is known. After dragging out the Blue line a Scale Information box will automatically appear. Enter the correct length in feet or meters. Then click OK.
Example Antenna Centerline: 40 feet

Figure 6.2 Setting Scale
Once the site has been scaled antennas can be added to the workspace and filled out with the desired parameters. After all of the information has been added the antenna can be moved and placed into position.
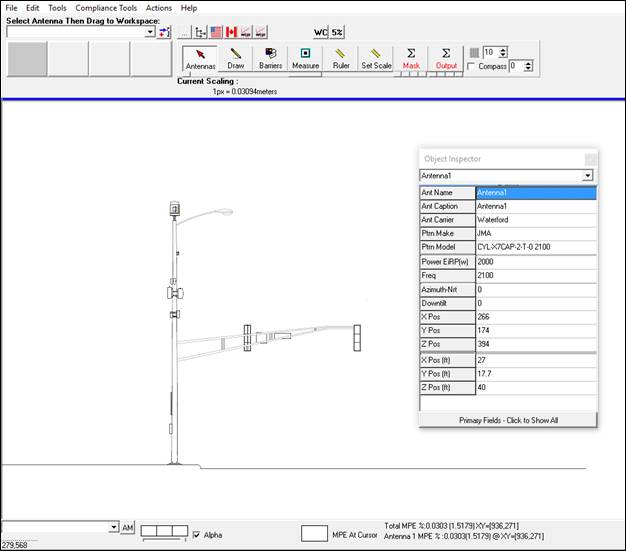
Figure 6.3 Antenna Placement
To complete the analysis, click the Output button to enter the Output mode. Next click the small box on the far left under the Output button to select the Sula9 Vertical Model then click Run.
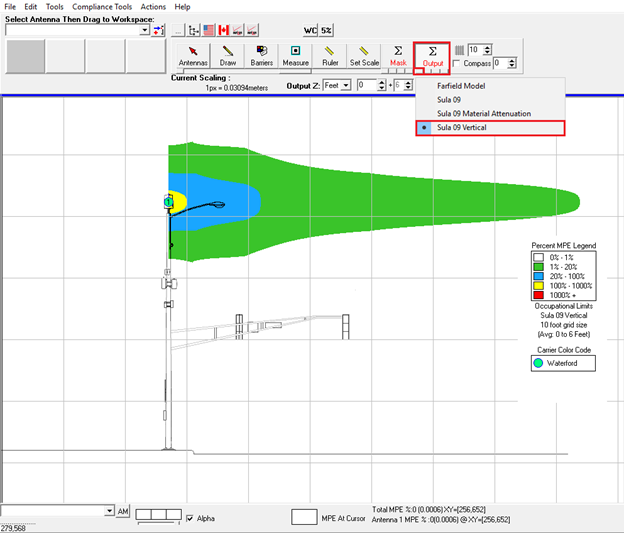
Figure 6.4 Sula9 Vertical Model
The RoofMaster™ Sula9 model takes into account antenna downtilt in the elevation plane. Mechanical downtilt settings are found in the antenna details, object inspector and table of sources. RoofMaster performs an inspection of the vertical plane antenna pattern to identify electrical downtilt. Mechanical and electrical downtilt are considered in MPE predictions. This feature is utilized in Rooftop and Vertical mode studies.
To apply Mechanical downtilt to an antenna right click the desired antenna and select the edit option to display the antenna details. Mechanical downtilt can also be applied through the Object Inspector
|
|
|
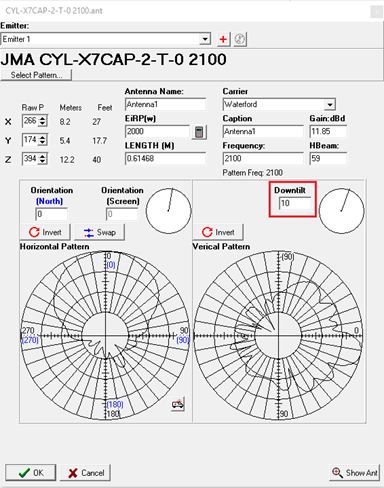
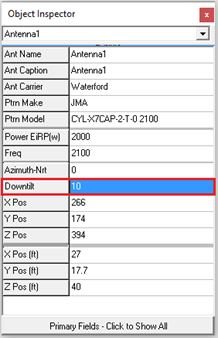
Figure 6.5 Mechanical Downtilt
For this example, 10 degrees of mechanical downtilt was applied to the antenna.
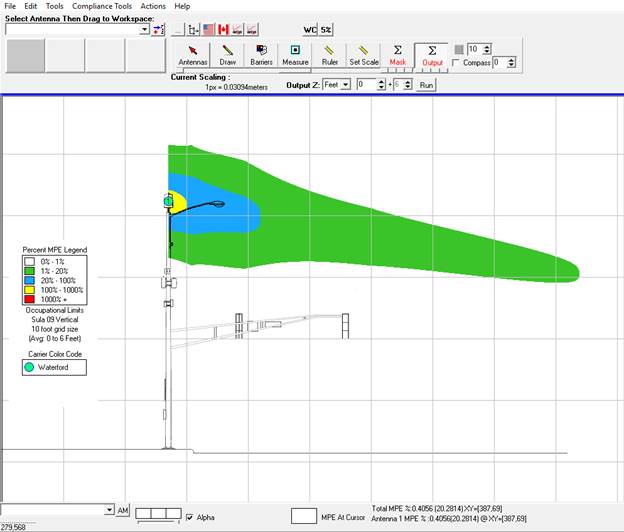
Figure
6.6 Analysis considering Mechanical Downtilt
7. Keyboard Shortcuts
RoofMaster™ contains a number of convenient keyboard shortcuts for common actions.
|
F1 |
Help |
|
F5 |
Refresh Output |
|
F7 |
Table of Sources |
|
F8 |
Display Antenna Table |
|
F9 |
Output Selections Window |
|
F10 |
Open External Drawing Tool |
|
F11 |
Show Object Inspector |
|
F12 |
Selected Antenna Blinking |
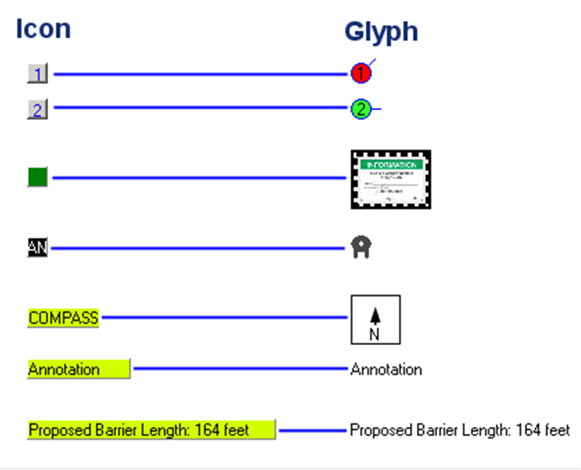
8. Icons and Metaphors
RoofMasterTM uses a number of icon and visual metaphors to represent antennas, mitigation items and other rooftop features. The icons are shown when the user is manipulating item locations and properties. Each icon also has a glyph representation when the program is in output mode.
Antennas use the same icon metaphor but differ in that they may contain properties for up to 8 emitter elements.
9. Glossary of Terms
A
Anchor: A fall arrest anchor icon can be added to the workspace
Ant Caption: Represents antenna index number
Ant Carrier: This field indicates which carrier the antenna belongs to
Ant Name: Represents that particular antennas number
Azimuth: This field represents where the antenna is pointing, measured in degrees
Azimuth-Nrt: Displays the antenna's azimuth based on a new North Orientation and is no longer facing true North
B
Barrier Stanchion: Represents the poles the barrier system is attached to.
C
Compass: Indicates the sites north orientation
D
Delete: Removes any antenna, text, anchor, measurement, barrier or sign from the work area
Display Antenna Table: Displays a worksheet of all the antennas on the work area as well as their information in numerical order
Display Sign Table: Shows a worksheet of all the signs on the work area along with their statuses
Downtilt: This is the field where the mechanical down-tilt of the antenna is inputted
Drop Sign: Displays a sign information box that allows the user to select the correct carrier, location, sign type and status. Black represents an existing sign, orange indicates a proposed sign and red designates an installed sign
E
Edit: Opens up the antenna information fields as well as the sign information fields
EiRP: Field where the effective isotropic radio power of the antenna is entered
ERP: Field where the effective radio power of the antenna is entered
Existing Barriers: Adds a black color coded barrier onto the work area with stanchion poles. The barrier can then be expanded to the appropriate length
F
Freq: This field allows the antenna's frequency to be entered
G
Gain Field: Where the antenna's gain capability is recorded
Grid: Transparent lines that can be selected and deselected on and off to show the site's scale.
H
Horizontal Beamwidth: Represents the beam width of the antenna across the horizontal plane
I
Installed Barriers: Adds a red color coded barrier onto the work area with stanchion poles. The barrier can then be expanded to the appropriate length
Invert: Allows the antenna's horizontal pattern or vertical pattern to flip-flop directions
L
Legend: Select a carrier legend and it will appear with the proper percentages measured in General Public Limits or Occupational Limits when the Output button has been clicked.
Length Field: Allows the antenna's dimensional length to captured
M
Marker: Dropping a marker represents the origin of both the antennas and signs X and Y values
Mask Tool: Used to indicate only the space wished to be represented in the modeling plots
Measurement: This feature adds a numerical text value to the work area which can represent a meter reading position. The value increases each time a new area is clicked
Multiple Measurements: This option opens a text box with multiple lines which become dynamic depending on how many lines are used
O
Object Inspector: Displays a data entry field for the antenna including position, frequency, power, azimuth and down tilt
Orientation (North): Displays the antenna's azimuth based on a new North Orientation and is no longer facing true North
Orientation (Screen): Displays the antenna's azimuth in relation to true North
Output Selections: Displays the layer options, which can be selected and deselected, that are shown on the modeling plots
Output Z: Creates a modeling plot in jpeg format in the results folder
Output: This button displays and allows the modeling to be run
P
Paste Antenna Parameters Feature: Provides the ability to copy one antenna's data and paste the same information into another antenna
Proposed Barriers: Adds an orange color coded barrier onto the work area with stanchion poles. The barrier can then be expanded to the appropriate length
Ptrn Make: Displays the manufacturer name of the antenna
Ptrn Model: Displays the model of the antenna
R
Re-index Local Library: Refreshes the antenna library allowing any new antennas added to RoofMaster™ to become available.
Results Folder: Holds all of the modeling plots once they are outputted
Rooftop Plot: Completes a modeling from a top down aerial approach
Run: Selecting this will run the modeling and recreate the site's environment
Ruler Tool: Measures anything in the work area in pixels, feet as well as meters.
S
Select Pattern: Opens the antenna library and allows a specific pattern to be selected
Set Scale Tool: This is used to set the scale of a drawing which gives the drawing an accurate spatial depiction
Spatial Averaging: RF radiation measuring technique used to determine the amount of RF exposure at a particular spot by averaging the electric and magnetic fields
Spatial Max: RF measuring technique used to determine the amount of RF exposure
Swap: Switches the horizontal pattern with the vertical pattern and vice versa
T
Text: Allows word text to be written and placed on the work area
Tower Plot: Completes a modeling from a profile elevation approach
V
Vertical Beamwidth: Represents the beam width of the antenna across the vertical plane
W
Workspace: The area where drawing lines, antennas, text, anchors, measurements, barriers or signs are placed and captured
XYZ
X Pos ft: Denotes the antennas horizontal position in feet
X Pos: Moves the antenna's pixel position across the horizontal plane on the work area
Y Pos ft: Denotes the antennas vertical position in feet
Y Pos: Slides the antenna's pixel position up and down the vertical plane on the work area
Z Pos ft: Signifies the antennas height measured in feet
Z Pos: Represents the antenna's pixel position in height
10. Support Information
Support for RoofMaster™ is available from the Waterford Consultants Customer Portal. You can login to your customer portal account from the WaterfordConsultants.com website. Per incident support options are available for a fee.
Enterprise customers can use the Remote Assistance option under the help menu or call their dedicated account representative for assistance.
Please email RoofMaster@waterfordconsultants.com or call 703.554.6134 for additional information.